The typical Italian owns twice as much as the typical German
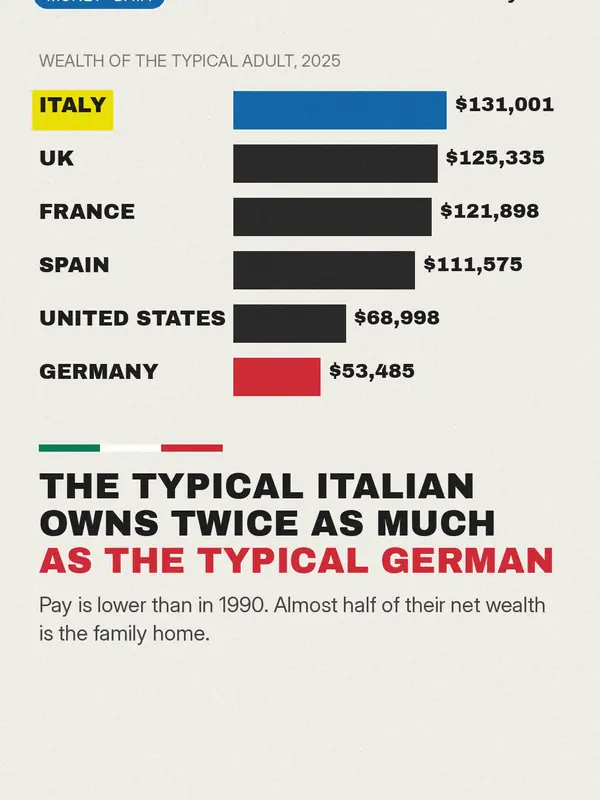
The typical Italian adult owns more than twice as much as the typical German: a median of $131,001 against $53,485 at the end of 2025, according to the UBS Global Wealth Report 2026. Yet average pay in Italy, after inflation, is slightly lower than it was in 1990. Both facts are true at the same time. This piece explains what the ranking measures, where Italian wealth sits, why most of it was built decades ago, who holds it and who is set to inherit it.
What the ranking measures
UBS, the Swiss bank, publishes its Global Wealth Report every year. Wealth here means net wealth: savings, investments and property, minus debts. For each country the report gives two figures.
- The average: total wealth divided by the number of adults. A small number of very rich people can push it up.
- The median: the wealth of the adult in the middle, with half the population above and half below. It says more about a typical person.
| Country | Median wealth per adult (US dollars) | Median (euros) | Average (euros) |
|---|---|---|---|
| Italy | 131,001 | 111,881 | 238,653 |
| United Kingdom | 125,335 | 107,042 | 250,071 |
| France | 121,898 | 104,106 | 291,536 |
| Spain | 111,575 | 95,290 | 261,689 |
| United States | 68,998 | 58,927 | 594,651 |
| Germany | 53,485 | 45,679 | 296,023 |
Figures at the end of 2025. Dollar values from UBS, euro values as published by Euronews.
On average, Germans are richer than Italians. On the median they are much poorer. According to Euronews' reading of the report, Germany ranks 14th in the world by average wealth and 30th by median, last among the countries in the median top 30, behind Greece. A wide gap between the two measures means that wealth is concentrated among fewer people. Euronews describes Italy's position as a sign of "a broader and more evenly distributed middle class".
Most of it is housing
The main reason is property. In 2025, 77.1% of people in Italy lived in a home owned by their household, according to Eurostat, the statistics office of the European Union. In Germany the figure was 47.2%, the lowest in the EU. The EU average was 68.5%. Most Germans rent; most Italians own.
The Bank of Italy, the country's central bank, puts the total net wealth of Italian households at €12,326 billion at the end of 2025, about 8.5 times their yearly disposable income (8.3 times a year earlier). Homes make up almost half of that net wealth: 49% in the bank's distributional accounts for the last quarter of 2025. Financial assets, before debts, came to about €6,500 billion, up 7.4% in 2025, mainly because the value of shares in Italian companies rose.
A house counts as wealth even if it produces no income and cannot easily be turned into cash. A family can be well off on paper and still be short of money each month.
A rich population and an indebted state
Italy's public finances look very different. Government debt was 136.7% of gross domestic product (GDP) in 2025, the second-highest ratio in the EU after Greece, according to Eurostat. Italian households, by contrast, borrow little. Their debt was 55.9% of their disposable income in 2025, against an EU average of 79.8%.
Wealth that was built in the past
Italians used to be known as big savers. That has changed. In 2025 Italian households saved about 10.8% of their disposable income, against 18.9% in Germany, according to provisional Eurostat figures. The Bank of Italy reports that in 2025 household income grew by 0.9% after inflation and spending grew at the same pace, so the saving rate did not change.
Pay has not grown either. According to the OECD, the Paris-based organisation of advanced economies, the average annual wage in Italy, measured at constant prices, was about €35,500 in 1990 and about €34,700 in 2025, roughly 2% lower.
Wealth has kept growing anyway. The Bank of Italy attributes most of the 2025 rise in financial assets to higher share prices, not to new saving. The stock of wealth is large; the flow of new savings that feeds it is smaller than in Germany.
Older households hold more of it
The Bank of Italy's household survey shows how the balance between generations has shifted. Between 1991 and 2022:
| Head of household | Share of households | Share of wealth |
|---|---|---|
| Over 65, 1991 to 2022 | rose to 28% | almost doubled, to 32% |
| Under 36, 1991 to 2022 | fell from 16% to 6% | fell from 13% to 4% |
Part of this is demographic: Italy has one of the oldest populations in the world, so there are more older households. But the share of wealth held by the young fell faster than their share of households.
Who will inherit it
In its annual report published in May 2026, the Bank of Italy says the main beneficiaries of the next wave of inheritances will be people born between 1966 and 1975. For them, inheritances could make up about 40% of their total wealth, against about 30% for earlier generations.
Inheritance already matters more than it used to. A study by the economists Paolo Acciari, Facundo Alvaredo and Salvatore Morelli, published in the Journal of the European Economic Association in 2024, found that the yearly flow of inheritances and gifts in Italy, measured against national income, roughly doubled between 1995 and 2016 (from 8.4% to 15.1% in the working paper version of the study).
More concentrated than in 2010
Italy's median is high, but wealth at the top has grown faster than in the middle. According to the Bank of Italy's distributional accounts, the richest 10% of households owned 60.6% of household net wealth at the end of 2025, up from 52.0% in 2010. The poorer half of households owned about 7%.
So two things hold at once. Compared with Germany or the United States, the typical Italian has more wealth and is more likely to own a home. Within Italy, the share owned by the richest has been rising for fifteen years.
What the figures do not show
- The UBS figures are per adult; the Bank of Italy figures are per household. They are not directly comparable.
- The UBS ranking is in US dollars, so exchange rates affect comparisons between countries.
- Housing wealth depends on market prices, which vary widely between regions. A flat in Milan and a house in a small town in the south can count very differently.
- A high median does not mean high incomes. It mostly reflects homes owned, often inherited or bought decades ago.
UBS, Global Wealth Report 2026 (30 June 2026); Euronews, 25 July 2026; Eurostat, datasets ilc_lvho02 (home ownership, 2025), tec00131 (household saving rate, 2025, provisional), gov_10dd_edpt1 (government debt, 2025) and household debt (2025); Bank of Italy, Annual Report on 2025 (29 May 2026) and distributional wealth accounts, Q4 2025; QuiFinanza, 29 May 2026; Acciari, Alvaredo and Morelli, Journal of the European Economic Association, 2024, and NBER working paper 27899; OECD, average annual wages (constant prices).
More in Economy & Money · Society
Watch the reel on InstagramFound this useful? The Italy Desk is free to read. A small tip helps us keep it that way.
Support us on Ko-fi